|
Wendy E. Mackay 1,2 Centre d'Études de la Navigation
Aérienne1 |
Laboratoire de Recherche en Informatique2 |
Permission to make digital/hard copies of all or part of this material for personal or classroom use is granted without fee provided that the copies are not made or distributed for profit or commercial advantage, the copyright notice, the title of the publication and its date appear, and notice is given that copyright is by permission of the ACM, Inc. To copy otherwise, to republish, to post on servers or to redistribute to lists, requires specific permission and or fee.
CHI 98 Los Angeles CA USA
Copyright 1998 0-89791-975-0/98/ 4..$5.00
DIVA supports exploratory data analysis of multimedia streams, enabling users to visualize, explore and evaluate patterns in data that change over time. The underlying stream algebra provides the mathematical basis for operating on diverse kinds of streams. The streamer visualization technique provides a smooth transition between spatial and temporal views of the data. Mapping source and presentation streams into a two-dimensional space provides users with a direct manipulation, non-temporal interface for viewing and editing streams.
DIVA was developed to help us analyze both qualitative and quantitative data collected in our research with French air traffic controllers, including video of controllers at work, audio records of telephone, radio and other conversations, output from tools such as RADAR, and coded logs based on our observations. Although our emphasis is on exploratory data analysis, DIVA's stream architecture should prove useful for a wide variety of multimedia applications.
KEYWORDS: Exploratory data analysis, Hypermedia, Multimedia, Protocol analysis, Streams, Stream algebra, Video
Video, audio and other data collected in field studies continue to be cumbersome to manage and analyze. We are interested in the problem of how to compute with a variety of these multimedia data types: to visualize, explore, analyze and evaluate relationships among streams of data.
Early systems to support analysis of video records were influenced by hypermedia, which is a logical extension of hypertext. Originally proposed by Vannevar Bush (1945), the basic approach organizes text into separate chunks that are linked together. Hypermedia adds images, audio and video, using hypermedia links (Conklin, 1987) to organize them. Hypermedia has become the dominant metaphor for managing multimedia data and is used in a wide variety of applications, including multimedia documents (Buchanan & Zellweger, 1992), education (e.g., Denning, 1997), games (e.g., Myst) and of course, the World Wide Web. An early tool for analyzing video data, VideoNoter (Trigg, 1989, Roschelle & Goldman, 1991) begins with data streams, and then uses hypermedia links to organize the relationships among different aspects of the data.
Another approach emphasizes streams instead of chunks of information. Rather than treating all data as chunks and converting naturally-continuous information such as video into discrete units; all data can be treated as streams, mapping naturally-discrete objects onto event streams. The analysis system can operate on all data in a uniform way, exploring directly the patterns that emerge from the streams. Hypermedia lets users start and stop streams; the stream approach lets them highlight, examine and compute upon the patterns within and among streams.
EVA, the Exploratory Video Annotator, (Mackay, 1989, Mackay & Davenport, 1989) was based on this approach. We were not interested in authoring multimedia documents that treat video as "illustrations that move". Instead, we were interested in helping researchers annotate and visualize patterns and relationships among time-based multimedia data. EVA's stream metaphor derived from our work on Muse, a multi-media authoring language originally designed at Digital Equipment Corp. and enhanced significantly at MIT's Project Athena (see Hodges & Sasnett (1993) for a description).
One of the authors (Mackay, 1989) suggested that the exploratory data analysis techniques pioneered by Tukey (1977) (see Hartwig & Dearing (1979) for a concise summary) are more appropriate for examining video data than the standard statistical techniques used in controlled laboratory studies. Sanderson and her colleagues (Sanderson et al., 1994, Sanderson & Fisher, 1994) have pursued this idea extensively, coining the term Exploratory sequential data analysis (ESDA) for systems that support the exploration of multimedia data. Several systems have been developed to support the analysis of video data, including Harrison (1991), Olson et al. (1994), Chua & Ruan (1995), and Plaisant et al. (1996). Other researchers working in related areas such as video conferencing have developed similar tools, e.g. the tools developed at Xerox PARC, including Where Were We? and its successors (Minneman & Harrison, 1993, Minneman et al., 1995, Moran et al., 1997), Marquee (Weber & Poon, 1994), and TimeWarp (Edwards & Mynatt, 1997).
Our current research (Mackay & Fayard, 1997a) seeks to provide air traffic controllers with the benefits of networked computing without forcing them to give up their successful existing work artifacts, in particular, paper flight strips. We began with a four-month field study, following a team of controllers at the Paris en route control center (Athis Mons). We are now analyzing over 100 hours of coded event streams, based on researchers' observations, approximately 50 hours of video of controllers at work, with corresponding radio, telephone and local conversations, output from RADAR and other devices, and copies of relevant artifacts, particularly paper flight strips.
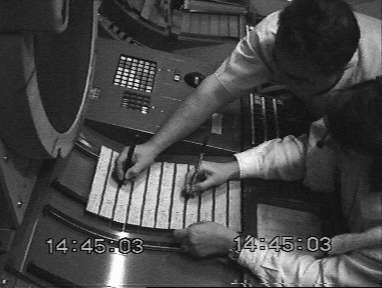
We use exploratory data analysis techniques to identify and analyze both qualitative and quantitative aspects of this data and are particularly interested in finding patterns that occur across media types. For example, Figure 1 shows two controllers writing simultaneously on two different flight strips, a relatively rare event. We are interested in understanding the circumstances that surround such situations. Are there other patterns of activity correlated with this one? Are the controllers more or less likely to talk to each other? Are they likely to perform other activities at the same time? Can we predict this pattern from other recurring patterns, e.g., stressful situations? Are there any events that help predict when this occurs?

Discovering the answers to these and related questions not only increases our understanding of the complexity of their work, but also helps us better understand how to create tools that support rather than interfere with their existing work practices, addressing problems without adding unnecessary costs (Mackay & Fayard, 1997b).
This article describes DIVA, a system designed to support computing with streams of multimedia data, enabling users to visualize, explore, analyze and evaluate patterns of data that change over time. We present the underlying system architecture, which involves a common representation for multimedia streams and an algebra for manipulating them. We next present the user interface, which provides interactive temporal and spatial views of the data. Throughout, we use examples from the air traffic control project to illustrate the interface to DIVA and explain how various stream operations work and why they are useful. We conclude with a summary of the contributions of DIVA and directions for future research.
DIVA uses the same stream metaphor as the earlier EVA system, with a more powerful set of operations derived from a stream algebra. Others have used algebras to deal with time-based data. For example, Algebraic video (Duda et al., 1996) defines an algebra to describe the spatial and temporal composition of video segments. However, the operators they use are different from DIVA, since the purpose of their system is the production of video presentations, not the analysis of time-based data. Rivl (Swartz & Smith, 1995) is a language that also focuses on video data and production tasks by providing graphical operators to create complex presentations.
This section describes the DIVA algebra, with examples derived from air traffic control data. The algebra is based on the notion of multimedia streams and a set of operators to create, modify, play and present streams.
A stream s of type T is defined as a sequence (ti) of n+1 clock times and a sequence (vi) of n values:
s = (t1: v1, t2: v2, ..., tn: v2, tn+1)
The sequence (ti) is increasing, so the stream can also be viewed as a sequence of stream segments [ti, vi, di]. The duration of the segment is di = ti+1 - ti. The values vi are either undefined (denoted as _|_) or a value of type T, e.g. boolean, integer, text or image. The value of a stream s at time t is noted s@t and is defined as follows :
The empty stream, noted () is a stream whose value is undefined for any time t.
If we begin with a video clip of two air traffic controllers writing on two paper flight strips, as in Figure 1, we have one stream of video data:
s.video = ( 1:00:00: frame0, 1:00:01: frame1,
1:00:02: frame2, ... , 1:03:00).
A data log is another type of stream, consisting of a series of boolean values that indicate the precise times at which specific events occur. For example, a boolean stream can identify every situation in which a controller writes something on a flight strip:
s.write = ( 1:00:05: on, 1:00:09: off, 1:02:49: on,
1:02:57: off, 1:03:00).
Session transcripts can be represented as a series of subtitles. For example, a text stream might identify every radio conversation between the radar controller and the pilot, with the specific text appearing as the value associated with each time segment:
s.radio = ( 1:00:21: "Maintain flight level",
1:00:34: _|_,
1:01:58: "Climb to level 310",
1:02:04: _|_, 1:03:00).
Streams can contain any type of values. For example, the RADAR screen presents a 2-dimensional view of the location of a set of airplanes moving in a 3-dimensional space. We can define a stream for each airplane that contains its position over time.
Before computing with streams, it is useful to normalize them: segments with a duration of 0 are removed, successive segments with the same value are merged, and leading and trailing segments with value _|_ are removed. In other words, if two segments with the same value are adjacent to each other, the normalized stream contains a single, longer segment. All streams in this discussion are assumed to be normalized. We define the extent of the stream as the interval [t1, tn+1] of its normal form.
Normalizing streams provides a canonical representation of a stream so that, for example, we know that two streams are equal if and only if their normal forms are the same. Normalizing streams also minimizes storage and reduces processing costs.
New streams can be created from existing streams by stream expressions, comparable to the expressions used to compute a cell from other cells in a spreadsheet. Given n streams s1, s2, ... sn of types T1, T2, ... Tn and a function f : T1 x T2 x ... Tn -> T, the stream expression f (s1, s2, ... sn) is a stream s of type T such that :
s@t = f (s1@t, s2@t, ... sn@t) for all t
It is assumed that f (_|_, _|_, ... _|_) = _|_.
A common stream expression is editing : a source stream s and an edit stream e, both of type T, are combined with the following edit function:
edit (vs, ve) = if (ve = _|_) then vs else ve
The resulting stream is the same as the source stream except that it is replaced with the edit stream where the edit stream is defined (Figure 2).

Usually, we use at least two researchers to code the activities. Some situations are ambiguous and we might have to discuss the final analysis. This technique allows us to work with one of the annotation streams made by one researcher and modify it based on the annotation stream created by another researcher.
Like editing, insertion and deletion are common operations on streams (Figure 3). Inserting a segment into a stream creates a new, undefined segment and offsets the subsequent segments accordingly. Usually, the inserted part is then replaced with the edit operation described above. Deletion removes and/or shortens segments so that a given interval is removed from the stream. The offset operation is a short-hand for inserting or deleting a segment before the start of the stream. The offset d can be positive or negative so that an entire stream can be offset forward or backward in time.
We need to present collections of examples of activities observed in our data. For example, we have a video that presents a series of clips of controllers writing on strips, pointing to the strips, and rearranging the strips. When we videotape a new session, we can easily insert new examples of these activities into the existing set of streams.
It is often useful to analyze when a given condition occurs before or after another condition. We call this operation time-filtering and define it as follows:
s1 = v1 within [d, d'] of s2 = v2
It creates a boolean stream s defined as follows:
The resulting stream describes when an occurrence of v1 in stream s1 occurs close to an occurrence of v2 in stream s2. The interval [d, d'] defines how close (or how far apart) we want the values to occur (Figure 4).

A variant of time filtering uses a condition that tests whether the whole segment containing v2 in stream s2 is within the time interval defined by [d, d']. These conditions generalize Allen's (1984) algebra on time intervals by introducing the notion of temporal vicinity (specified by d and d'). This is necessary for the type of data analysis we are interested since we need to be able to look for events that occur at times close to each other.
When two controllers interact with the same set of strips at the same time, it is an indication of a "charged" situation. We can find out if there is always a corresponding rise in the number of new flights or an increase in conversations between the radar controller and the pilot, just prior to this event. We can then perform a time series analysis on the result with an external tool to determine which activities cluster together and whether or not we can predict the occurrence of some activities based on the occurrence of others.
The last operation defined by the algebra stretches the segments of a stream by a duration d. Each segment is extended at the beginning and at the end by d if the adjacent segment is undefined. Stretching is very useful to create a control stream (see below) that includes some context around a specified set of clips (Figure 5).

In order to play a stream, it must be bound to a time base. Several streams are synchronized by binding them to the same time base. A time base is defined by a start time, a stop time and a rate. It generates a time value that changes over time at a pace defined by its rate. The rate is a real number that specifies whether the time base runs forward or backward at slow, normal or fast speed or whether it is stopped (like the jog-shuttle of a VCR).
A time base can have a control stream: the time base skips undefined segments of the control stream as it runs, making it easy to play sequences of clips not originally adjacent to each other in the original streams.
If we are interested in looking at situations where more than one controller writes at the same time on a strip, we create a stream identifying this condition, stretch it by 1 or 2 seconds, and use the resulting stream as the control stream. We can then view in succession all clips in which more than one controller writes at the same time.
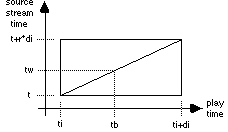
A more sophisticated method of controlling playing is to define the mapping between the time delivered by the time base and the time used to index the streams. This mapping is defined by a stream called the warping stream. Values of a warping stream ws are pairs (t, r) of time values and rates. Let tb be the time delivered by the time base (called the playing time) and let [ti, vi, di] be the segment of the warping stream such that ti <= tb < ti + d. Then ws@tb = vi = (t, r) where t is a time and r is a rate. The warping tw of time tb is defined as tw = t + r*(tb-ti).
Time warping of a segment is illustrated in Figure 6. The slope of the diagonal line indicates the rate. If the slope is 45º, the rate is 1 and the clip plays at normal speed. If the slope is under 45º, the clip plays in slow motion, while if the slope is over 45º the clip plays in fast motion. Finally if the diagonal appears in the other direction, the clip plays backward (at a rate determined by the slope).
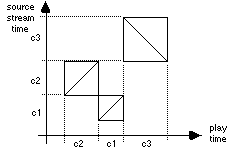
Time warping makes it possible to take any combination of clips from the streams and play them in any order and at any rate (Figures 7a and 7b).

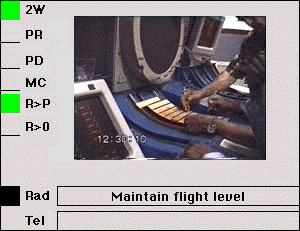
Like EVA and later Video Mosaic (Mackay & Pagani, 1994), DIVA provides two views of the stream data: temporal and spatial. Spatial views show the current value of a set of streams at the current time of their time base. Figure 8 shows an example with a video stream in the middle, boolean streams on the left side and text streams at the bottom. Two air traffic controllers are writing on the strips at the same time (stream 2W). The radar controller is telling the pilot to "Maintain flight level" (stream Rad) and the corresponding boolean stream for talking to the pilot (stream R>P) is on. No one is speaking on the telephone (stream Tel), and the activity code for conversations between the two controllers is off (stream R>O). Other activity codes, including pointing to the RADAR (PR), adjusting the Digitatron (PD) and adjusting the RADAR image (MC) are also off. Note that these activity codes are defined by the user.
Temporal views show abstracted versions of the changing state of a set of streams in relation to each other. This gives us the ability to "lay out time in space" and interact with various streams in parallel. The temporal view of a stream displays the stream segments along a timeline. In horizontal display, segments are represented by rectangles whose position, size and color represent the segment time interval and value. A boolean stream can be displayed by assigning a different color to its true and false segments or by appearing and disappearing. An integer stream can be displayed as a histogram and more complex streams can combine color and height (Figure 9). For a video stream, the temporal view can present a sequence of video "best frames", as is often done in commercial systems such as Adobe Premiere.
Spatial and temporal views complement each other. Spatial views help capture relationships between the current values of different streams and, since they are animated, provide a dynamic display that helps identify patterns of changes over time. Temporal views help identify longer term patterns within and among streams. By showing both past and future events, temporal views help anticipate what is coming up in the spatial views.

In order to better visualize and interact with streams, DIVA integrates both types of views into a single display. We were influenced by the video streamer (Elliot, 1993), which generates a stream from a video sequence by offsetting the edges of each video image. Cruz & Hill (1994) have also used this technique to visualize changes in audio level and button states in a video conferencing application. We have generalized this technique to display the changes in multiple streams of any type.
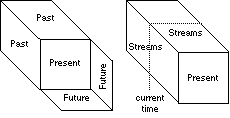
Figure 10 illustrates the smooth transition between the spatial and temporal views. The streamer display includes a spatial view in the center of the main window and a temporal view around it. When the set of streams is played, the temporal view streams up or down (depending on whether it is played forward or backward) so that the spatial view in the central display is always positioned correctly relative to the streams: streams along the edge of the spatial view seem to leave a trace that corresponds to the temporal view. When the temporal view is "streaming", the parts to the left and top of the central screen show a trace of what has already occurred whereas the parts to the right and bottom of the central screen show what is about to occur (Figure 11-a).
We have also experimented with the display depicted in Figure 11-b. Here, the streams are fixed: instead of moving when playing the sequence, a cursor indicates the current time in the temporal view. The first display works well for very large sequences because it provides context around the current time. The second display collapses long streams into a small screen space, reducing accuracy for both the display and the interaction. Either display makes it easy to detect changes in state as the image "streams" forward or backwards in time.
On a 21" screen, the streamer display can accommodate a large number of streams: up to 2 video streams, 5 to 10 text streams and 30 activity streams. The user can decide which streams to display and can define groups of streams that can be displayed or hidden together. The bottom of the display (not shown) contains a VCR-like interface to control the time base. Any stream can be designated as the control stream and warping streams can be edited in a separate window.
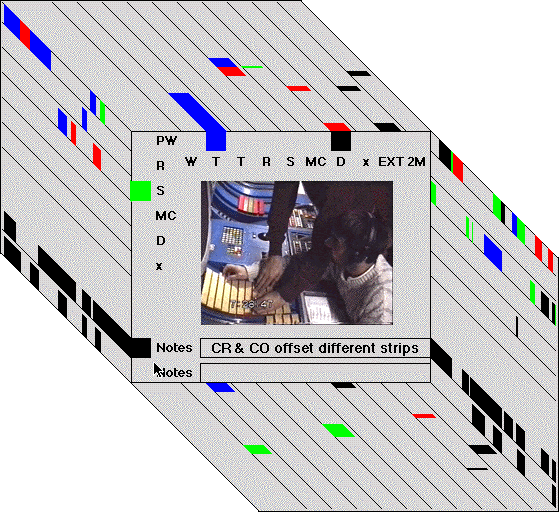
Streams can be created from files in various formats: recorded video or audio signals, a column or row from a spreadsheet, a text file, the output of devices such as the Digitatron or the RADAR, etc. Figure 10 shows actual data imported from an Excel spreadsheet. Streams can also be exported to these file formats, which makes it easy to use spreadsheets or statistical analysis packages to conduct other kinds of data analysis.
Streams can also be created explicitly by the user: the user defines the type and names of the stream in the stream's creation box (Figure 11). The user can then work in live mode by starting the time base and clicking the value buttons in the creation box to create segments. Each click creates a segment that starts at the time of the click. The user can also work in off-line mode by selecting a start and stop time in the time base control panel and a value in the stream creation box. This creates a new segment in the stream with the specified times and value. Several streams can be created simultaneously by opening as many creation boxes as necessary, and keyboard equivalents can be defined for each stream to speed up input.
For example, to code the data in a video stream, a user may create a set of binary streams that identify specific activities of the controllers. The user creates a stream and specifies its short and long names (e.g. "2W" and "Two controllers writing simultaneously"), its type (boolean) and its colors (e.g. green and red). The user then starts the time base and records stream values by clicking the on/off/undefined buttons in the creation box at the appropriate times. Since the rest of the interface is active, the user can see the other streams play in the main display, especially the video streams.
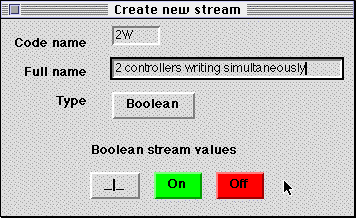
Streams can also be created with the stream algebra. After selecting the "expression" type in the stream's creation box, the user can enter a stream expression using any of the operators of the stream algebra. By default, the resulting stream is re-computed every time a stream that appears in the expression is changed, as in a spreadsheet.
For example, if the user is interested in seeing the video segments in which two controllers are writing on the flight strips at the same time (stream 2W) and the radar controller is talking to the pilot (stream R>P), the user can perform a logical and between the two relevant streams:
2W = on and R>P = on
The resulting stream shows situations in which both events occur simultaneously. In order to find situations where the two controllers write at the same time shortly after the radar controller talks to a pilot, the expression uses time filtering:
2W = on within [0, 2s] of R>P = on
The user can further investigate these events by stretching the stream to provide context, making it the control stream and playing the result.
DIVA allows the user to edit existing streams in several ways, depending on the type of the stream and the scope of the edit. Streams that result from stream expressions cannot be edited directly since they are re-computed each time one of their dependent streams is modified. However the stream expression itself can be edited to re-create the stream.
The value of a segment can be changed by clicking on it when it is visible in a temporal or spatial view. The start and stop times of a segment can be changed in a temporal view by selecting a segment and dragging or resizing it. They can be changed in a spatial view by selecting the view when the segment is visible and setting the start and stop times in the time base control panel. Such editing is used mostly to fine-tune a stream after it has been created in live mode.
More radical editing is achieved by creating an "edit" stream with one of the stream creation methods (usually live mode) and using the "edit" operation of the stream algebra on the original stream. This modifies the original stream and creates an "undo" stream that can re-generate the previous version of the stream from the modified version with the same "edit" operation of the stream algebra. This is often used to re-record a part of a stream that is incorrect.
The stream algebra can be used to apply the same operation to a set of streams. This is mostly used with the insert, delete and time-warping operations to reorganize the contents of a set of related streams. For example, once a specific set of events has been identified, all the irrelevant segments in all the streams can be deleted to keep only the interesting material.
Editing the warping stream is performed in a separate window similar to the display in Figure 7. Clips can be reordered, stretched or shrunk by direct manipulation. Several warping streams can be created and edited, but at most one can be designated as the current warping stream.
The first prototype of DIVA was implemented in Tcl/Tk (Ousterhout, 1994), which allowed us to validate the key concepts of DIVA: stream algebra, streamer display and time-warping. The second version (currently under development) is implemented on the Apple Macintosh as a set of extensions to Tcl/Tk, which allows us to reuse parts of the prototype. We use QuickTime (Apple Computer, 1993) to implement the time base and to play audio and video streams. The stream algebra is implemented in C++ for better efficiency. The current version is functional and we are re-implementing a larger part of the system in C++.
DIVA provides a significant advance over the earlier EVA system at both the architectural level and the user interface level. The major contributions at the architectural level include:
DIVA's user interface is designed to support the generation and analysis of not only the multimedia streams themselves, but the relationships among them. The major contributions at the interface level include:
Informal evaluations using data from our study of air traffic controllers have shown the power of linking the spatial and temporal views. Compared with a spreadsheet display, the dynamic aspect of streaming gives an entirely different perspective on the data. We were also able to isolate key events using the stream expressions. We plan to conduct more in-depth evaluations of DIVA as we analyze additional data sets.
DIVA is clearly designed to support a particular kind of interaction with multimedia data, i.e. exploratory data analysis. Yet the stream algebra and the streamer interface should be useful for a variety of other multimedia applications, including analysis of video conferencing, editing for multimedia presentations, educational applications and games.
Thanks to Eddie Elliot and Glorianna Davenport for conversations about the streamer technique, which we found to be a wonderful solution to our interface problem. Also, thanks to Anne-Laure Fayard for all her work on data coding and analysis and to the members of Equipe 9West at Athis Mons en route air traffic control center, for generating all that data!
Apple Computer (1993) Inside Macintosh - Quicktime. Reading, MA: Addison Wesley.
Allen, J.F. (1984) Towards a general theory of action and time. Artificial Intelligence. 23, pp. 123-154.
Buchanan, M.C. and Zellweger, P.T., (1992) Specifying Temporal Behaviour in Hypermedia Documents, in Proc ECHT'92, European Conference on Hypermedia Technology, Milan, Italy.
Bush, V. (1945) As We May Think. Atlantic Monthly , July issue, pp.101-108.
Chua, T.S. & Ruan, L.Q. (1995) A Video Retrieval and Sequencing System. ACM Transactions on Information Systems. 13(4), pp. 373-407.
Conklin, J., (1987) Hypertext: A Survey and Introduction, IEEE Computer, 20(9), pp. 17-41.
Cruz, G. & Hill, R. (1994) Capturing and playing multimedia events with streams. In Proc. Multimedia '94, pp. 193-200, ACM.
Denning, P.J. (1997) How we will learn. In Beyond Calculation: The Next Fifty Years. pp. 267-286. New York, NY: Copernicus.
Duda, A., Weiss, R., & Gifford, D.K. (1996) Content-based access to Algebraic Video. IEEE Multimedia.
Elliott, E.L. (1993) Watch-Grab-Arange-See: Thinking with Motion Images via Streams and Collages. MIT MS Visual Studies Thesis.
Edwards, W.K. & Mynatt, E.D. (1997) Timewarp: Techniques for autonomous collaboration. In Proc. CHI '97 Human Factors in Computing Systems. pp.218-225. Atlanta, GA: ACM.
Harrison, B. (1991) Video annotation and multimedia interfaces: from theory to practice. In Proc. Human Factors Society 35th Annual Meeting, pp. 319-323.
Hartwig, F. & Dearing, B.E. (1979) Exploratory Data Analysis. Beverly Hills, CA: Sage Publications.
Hodges, M.E. & Sasnett, R. (1993) Multimedia Computing: Case Studies from MIT Project Athena. Cambridge, MA: Addison-Wesley.
Mackay, W. E., & Davenport, G. (July, 1989) Virtual Video Editing in Interactive Multimedia Applications, Comm. ACM, 32(7), pp. 802-810.
Mackay, W. E. (October, 1989) EVA: An Experimental Video Annotator for Symbolic Analysis of Video Data, ACM SIGCHI Bulletin, 21(2), pp. 68-71.
Mackay, W.E. and Pagani, D. (October 1994). Video Mosaic: Laying out time in a physical space. In Proc. Multimedia '94. San Francisco, CA: ACM.
Mackay, W.E. & Fayard, A.L. (1997a) HCI, Natural Science and Design: A Framework for Triangulation Across Systems. In Proc. DIS '97, Designing Interactive Systems, Amsterdam: ACM.
Mackay, W.E. & Fayard, A.L. (1997b) Radicalement nouveau et néanmoins familier: Les strips papiers revus par la réalité augmentée. In IHM'97 Actes 9èmes Journées sur l'Interaction Homme-Machine., Poitiers, France: Cépaduès Editions.
Minneman, S. and Harrison, S.R.(1993) Where Were We: Making and using near-synchronous, pre-narrative video, In Proc. Multimedia '93, pp. 1-6, Anaheim, CA: ACM.
Minneman, S., Harrison, S., Janssen, B., Kurtenbach, G., Moran, T., Smith, I. & van Melle, W. (1995) A confederation of tools for capturing and accessing collaborative activity. In Proc. Multimedia '95. San Francisco, CA: ACM.
Moran, T., Palen, L., Harrison, S., Chiu, P., Kimber, S., Minneman, S, van Melle, W., & Zellweger, P. (1997) I'll get that off the audio: A case study of salvaging multimedia meeting records. In Proc. CHI '97 Human Factors in Computing Systems. Atlanta, GA: ACM.
Olson, G.M., Herbsleb, J. & Rueter, H. (1994) Characterizing the sequential structure of interactive behaviors through statistical and grammatical techniques. Human-Computer Interaction, 9(3), pp. 427-472.
Ousterhout, J.K (1994) Tcl and the Tk Toolkit. Reading, MA: Addison-Wesley.
Plaisant, C., Milash, B., Rose, A., Widoff, S., Shneiderman, B. (1996) LifeLines: Visualizing Personal Histories. In Proc. CHI'96, Human Factors in Computing Systems. pp. 221-227. Vancouver, BC: ACM.
Roschelle, J. & Goldman, S. (1991) VideoNoter: A productivity tool for video data analysis. Behavior Research Methods, Instruments and Computers. 23, pp. 219-224.
Sanderson, P., Scott, J., Johnston, T., Mainzer, J., Watanabe, L., James, J. (1994) MacSHAPA and the enterprise of exploratory sequential data analysis. (ESDA), International Journal of Human-Computer Studies, 41(5), pp. 633-681.
Sanderson, P. & Fisher, C. (1994) Exploratory sequential data analysis: foundations. Human-Computer Interaction, 9(3), pp. 251-317.
Swartz, J. & Smith, B. (1995) A resolution-independent video language. In Proc. Multimedia '95, San Francisco, CA: ACM.
Tukey, J.W. (1977) Exploratory Data Analysis.. Reading, MA: Addison-Wesley.
Trigg, R.H. (1989) Computer Support for Transcribing Recorded Activity. ACM SIGCHI Bulletin: Special Issue on Video as a Research and Design Tool, 21(2), pp. 72-74.
Weber, K. & Poon, A. (1994) Marquee: A Tool for Real-Time Video Logging. Proceedings of CHI'94, Human Factors in Computing Systems. pp. 58-64. Boston, MA: ACM.