Presentation
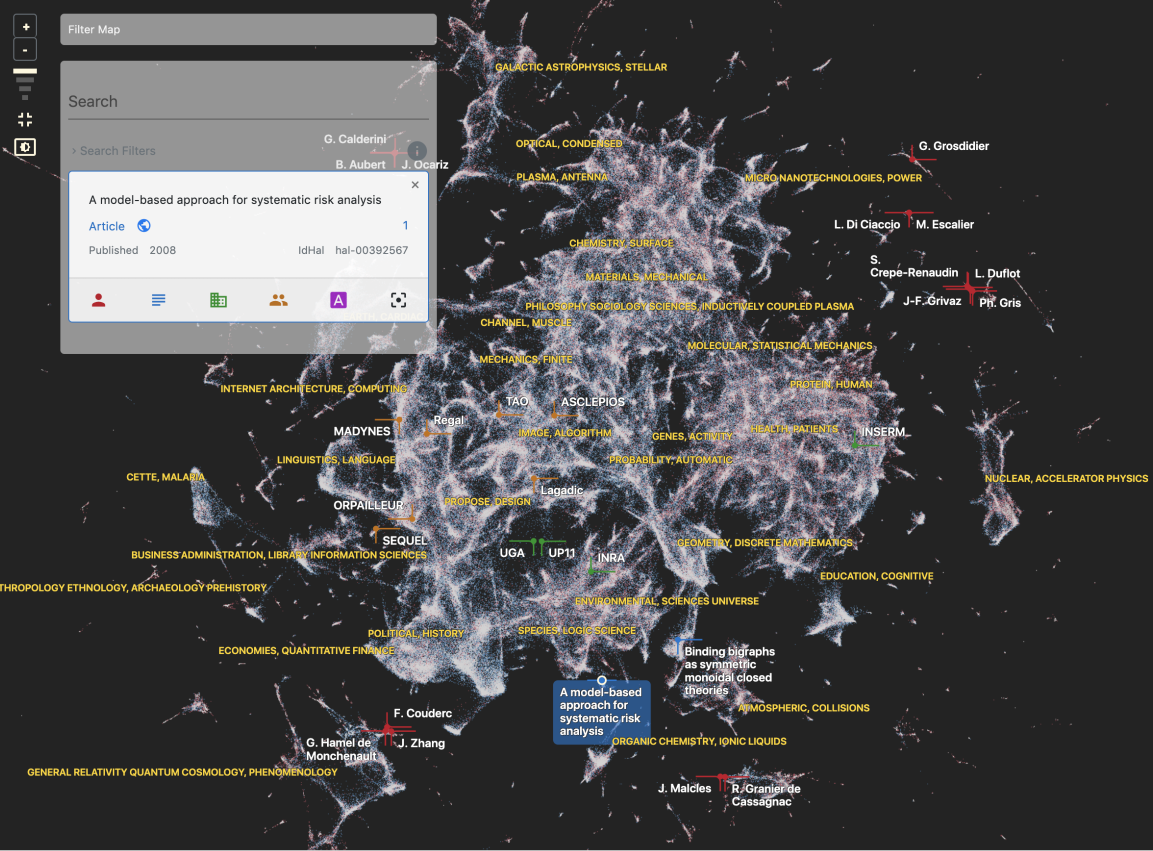
The goal of Cartolabe is to build a visual map representing the scientific activity of an institution/university/domain from published articles and reports. Using the HAL Database that contains all the publication of French public research institutions, Cartolabe provides the user with a map of the topics, authors, and articles. ML techniques are used for dimensionality reduction, cluster, and topic identification; visualization techniques are used for a scalable 2D representation of the results. In summary, similar articles are close-by, and less similar articles are farther away; only the distance between articles counts, not the position. Authors are considered as the concatenation of their articles, as well as higher-level entities (laboratories, institutions, etc.)
Cartolabe has, in particular, been applied to the Grand Debat dataset (3M individual propositions from French Citizen, see https://cartolabe.fr/map/debat). The results were used to test both the scaling capabilities of Cartolabe and its flexibility to non-scientific and non-English corpora. We also added sub-map capabilities to display the result of a year/lab/word filtering as an online generated heatmap with only the filtered points to facilitate the exploration. Cartolabe has also been applied in 2020 to the COVID-19 Kaggle publication dataset (Cartolabe-COVID project) to explore these publications.
Technical Description
CARTOLABE comprises two modules that can be used independently: a data processing module and a visualization module respectively referred to as CARTOLABE-DATA and CARTOLABE-VIS. Both modules are publicly available, with a BSD-2 license, and can be customized for various document collections. CARTOLABE-DATA uses unsupervised text analysis, providing multiple NLP methods, to build a 2D representation of the document collection. This collection (typically encoded as a csv file) is first processed to yield a compressed representation (a JSON file) including all information required for the visualization (entity labels, 2D coordinates and nearest neighbors). CARTOLABE-VIS imports this JSON file and acts as a visualization server to display the map from web browsers, supporting its flexible exploration by the user.
Cartolabe is unique in its ability to manage very large document corpora (e.g., Wikipedia with 5 million documents), to visualize them in real-time through the web, in the way it computes the labeling of areas and points. It raises the limit of large document corpora visualization. It also provides quality measures through scoring to make sure the NLP techniques used are the best according the the state-of-the-art (from LSA, LDA to encoders and LLMs).
Short History and Funding
After a first prototype available in 2017, a complete refactoring has been run in 2018-2019 to publish the first operational version, thanks to a 18 months CNRS platform engineer, with an IEEE publication and the opening of the source code on https://gitlab.inria.fr/cartolabe. An Inria ADT (Action de Développement Technologique) during the period 2020-2023 has hardened the code, set continuous integration, improved the packaging and the deployement. The projet uses 3 virtual machines for experimentation, staging and SaaS production hosting. Additionnaly a computing server is use for off-line maps generation (7k€, 2018, Inria fundings). The current team is composed of 3 permanent researchers from A&O and AVIZ teams and a part-time engineer.
Target Users
Users are the project team, external collaborations like 'Grand Débat National', Pôle-Emploi / France-Travail or Académie des Technologies and some academical collaborations like Paris-Saclay University (Learning Center, DataIA) or Sofware-Heritage. The goal of each collaboration is to tune the data-pipeline for a given use-case and to produce the corresponding map, wich is added to the map-list of Cartolabe.