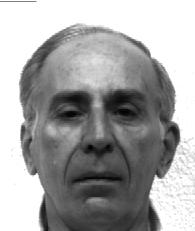
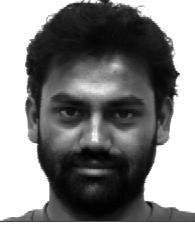
Aim : to build statistics of a set of images, i.e., to compute a mean image + modes of variation, which represent the variability of the set Method : based on deformations between images Difficulties : morphing an image to another one automatically, defining and computing the mean image, and expressing statistics Application : a dataset of faces + expression recognition task
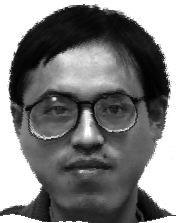
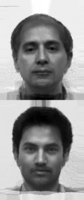
Brute mean face (= average of the first row)
[naive way to proceed]
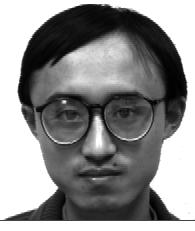
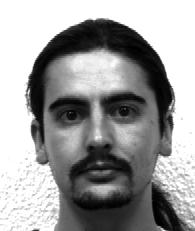
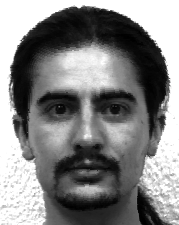
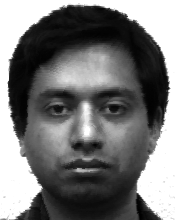
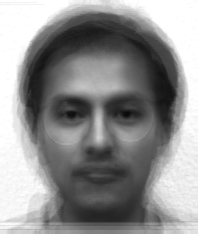
Mean face (= average of the second row)
[our method]
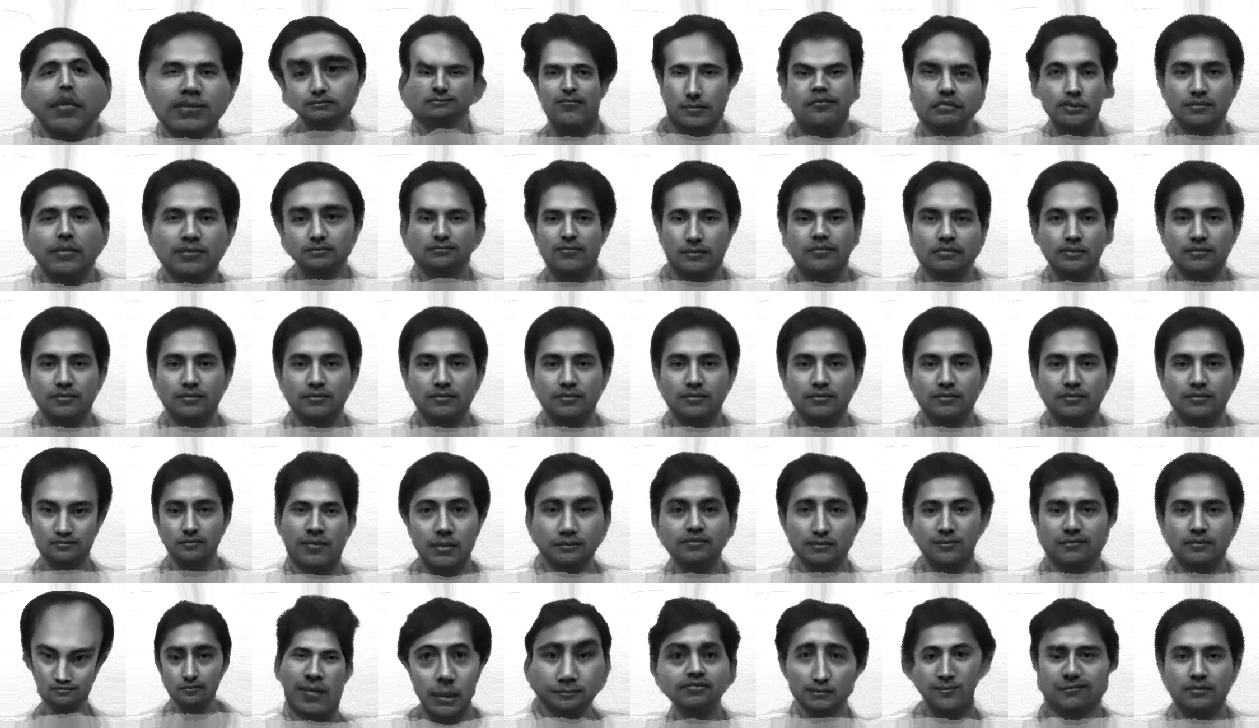
Modes of pure spatial deformation:
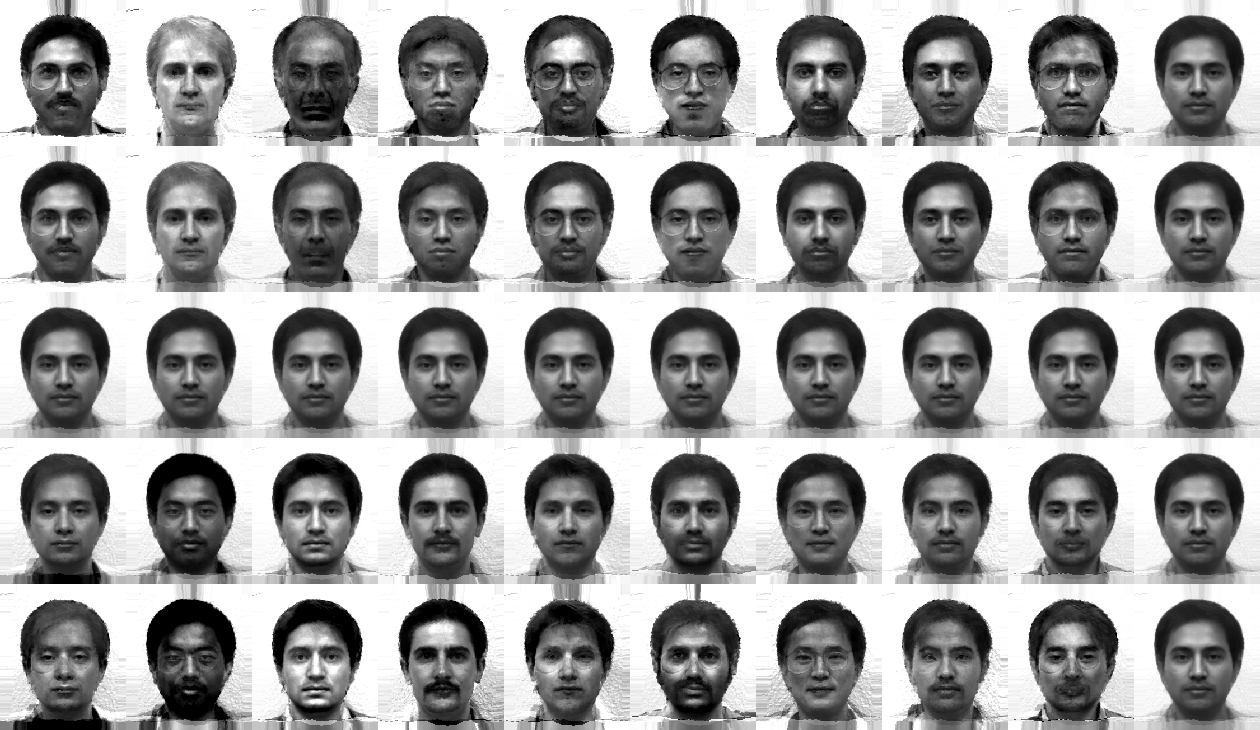
Each column stands for one mode; each column consists of one mode applied with different amplitudes (2 A, A, 0, - A, -2 A) to the mean face, where A is the standard deviation associated to this mode. The first and last lines, with amplitudes +-2A, are exaggerations in order to better visualize the variations.
Modes of pure intensity variation:
We then removed the 8th subject because of his glasses.
Modes of mixed spatial/intensity variations (click on them to see the corresponding animation, or click
here for the zoomed global image):
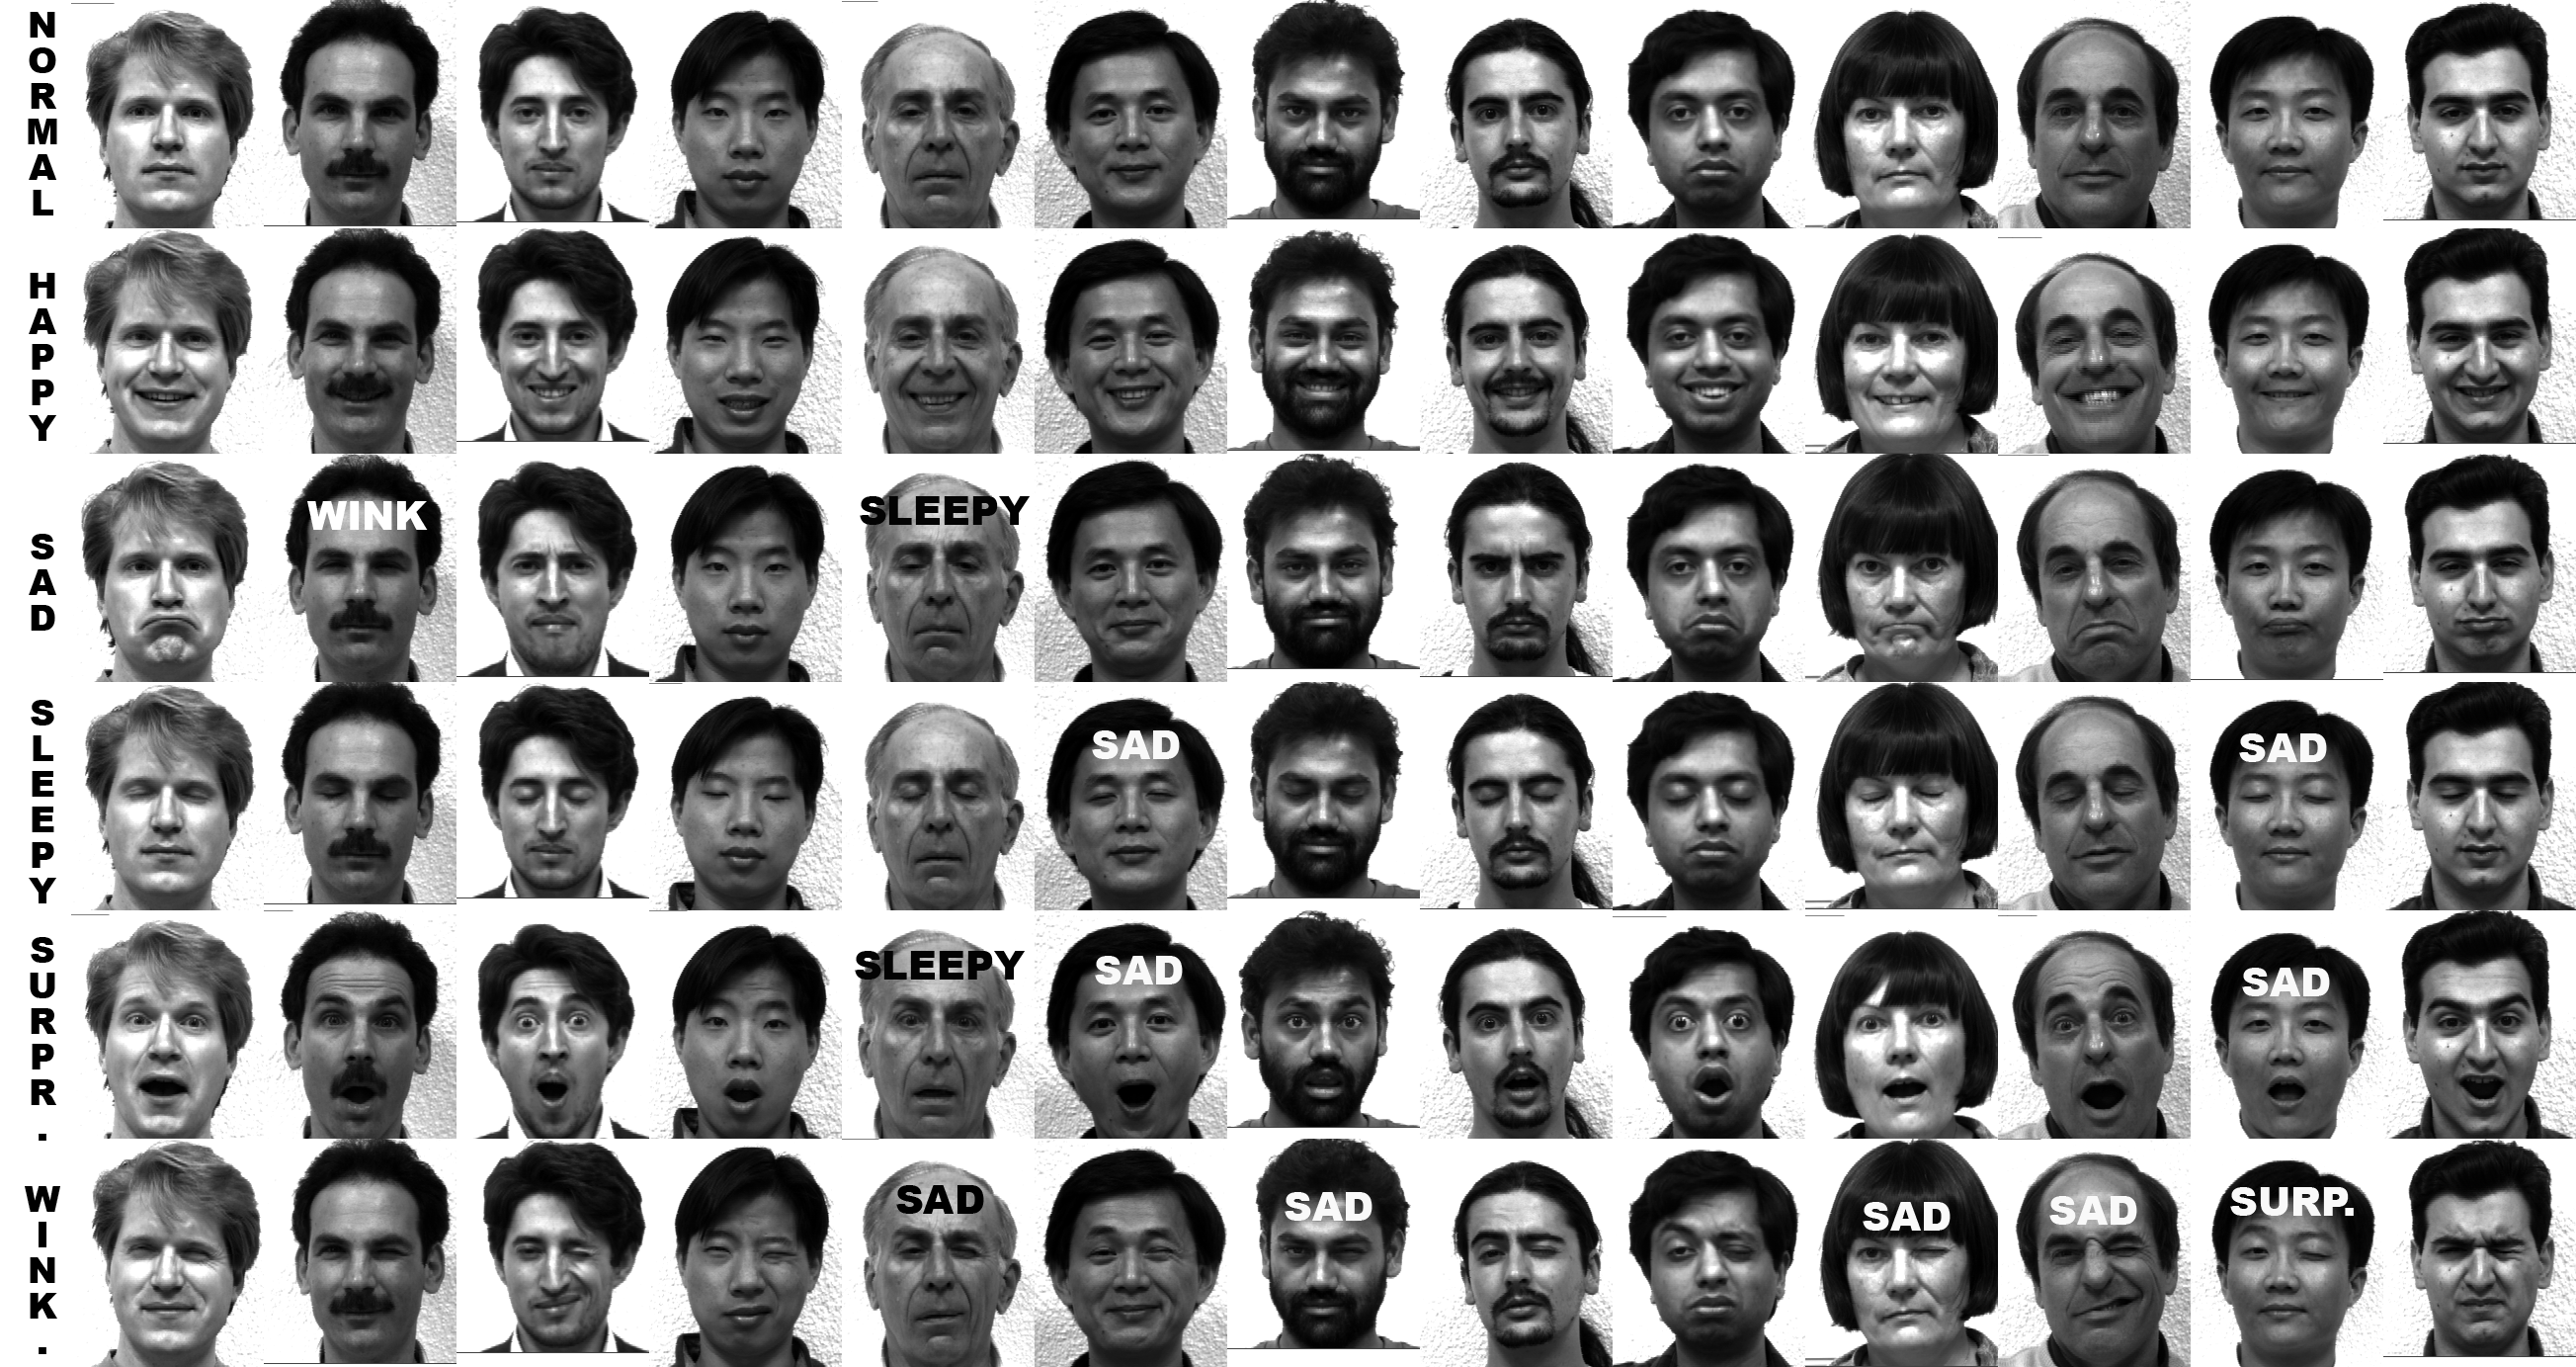
We also performed a facial expression recognition task (by computing automatically a deformation from each subject's face in "normal" state towards his face with the expression to be recognized, and by classifying these deformations): (When nothing is written, the expression has been recognized successfully; whereas a written word on a face indicates the wrong expression assignment)